A Candle Tells a Story
1 Read
Read the class below, including each diagram, then tick the box.
This course is free to read. Sign in to tick off each class, take the quizzes and earn the certificate.
Open almost any trading chart and you will see rows of little green and red bars. They are called candles, and once you can read one, you can read them all. This might be the most useful five minutes you spend.
New words in this class: candle, body and wick.
One candle, one story
A candle shows what price did during one period of time: one minute, one hour, one day, you choose. Each candle tells a story in four parts:
- Open: where price started.
- High: the highest it went.
- Low: the lowest it went.
- Close: where it finished.
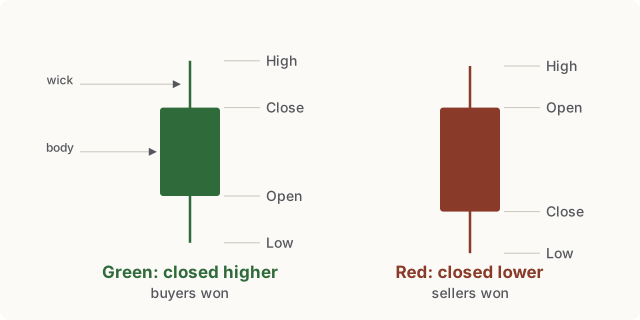
- The thick part is the body. It runs from the open to the close.
- The thin lines above and below are the wicks. They reach up to the high and down to the low.
- Green means it closed higher than it opened. Red means it closed lower.
That’s it. Four prices, two colours.
Small candles add up to big ones
A candle can stand for any stretch of time. Put six one-hour candles together and you get one six-hour candle: the first open, the highest high of all six, the lowest low of all six, and the last close.
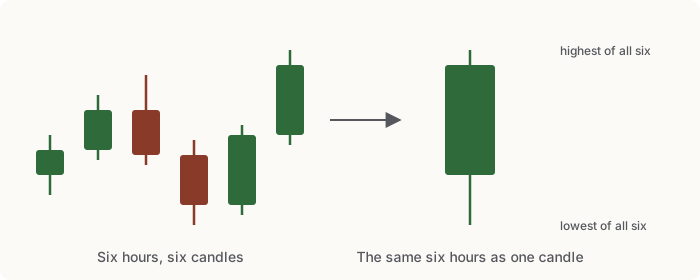
So a daily candle is a whole day’s story squeezed into one shape, and a weekly candle is a whole week’s. Bigger candles tell bigger stories. Keep that in mind: it becomes very important later.
Try it
Build your own candle. Move the four sliders, watch the shape change, and read the story it tells. Then see if you can complete all four challenges.
This practice game needs JavaScript turned on.
Remember
- A candle shows one period: its open, high, low and close.
- The body runs from open to close; the wicks reach the high and the low.
- Green closed higher than it opened; red closed lower.
2 Check yourself
4 questions. Pass mark 70%. Retake as often as you like; your best score counts.