What a Trend Is
1 Read
Read the class below, including each diagram, then tick the box.
This course is free to read. Sign in to tick off each class, take the quizzes and earn the certificate.
What you will be able to do
- Define an uptrend, a downtrend, a range and a transition in words you can test on a chart.
- Explain why a trend always belongs to a timeframe.
- Explain, briefly, why trends exist and what the research says about them.
- State the four questions every trend read has to answer.
A working definition
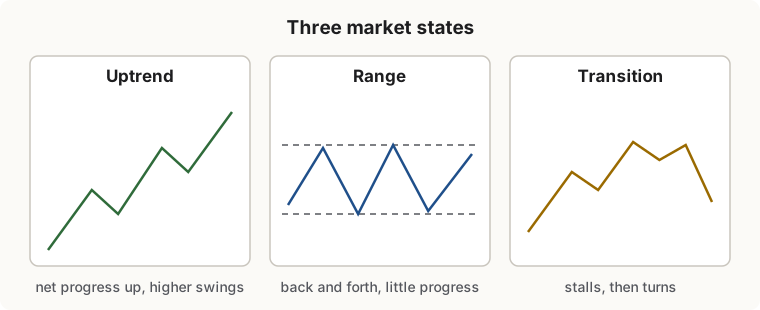
A trend is a persistent drift of price in one direction, large enough relative to the market’s normal back-and-forth that it stands out from the noise.
Each part of that sentence matters:
- Persistent: one big candle is not a trend. A trend shows up over many bars.
- Drift in one direction: price makes progress. Over the period, it ends meaningfully higher (uptrend) or lower (downtrend) than it started.
- Relative to the noise: every market wiggles. A move of 50 pips is a trend on a 15-minute chart of EUR/USD and nothing at all on a monthly chart. A trend is judged against the size of the normal swings on the chart you are reading.
The opposite of a trend is a range (also called sideways, consolidation or a trading range): price moves back and forth between a ceiling and a floor and makes little net progress, however much it moves along the way.
Between the two is a transition: a trend that has stopped making progress but has not yet reversed, or a range that is starting to break out. Much of the hard work of trend reading happens here.
Trends belong to timeframes
Ask “is EUR/USD trending?” and the only honest answer is “on which chart?”. The same week can be:
- a downtrend on the 1-hour chart (four days of lower highs),
- a range on the daily chart (the week sits inside last month’s high and low),
- an uptrend on the weekly chart (the last eight weeks have climbed).
All three are true at once. A trend on one timeframe is often a pullback on the next larger one and a series of ranges on the next smaller one. This is why every trend read in this course names its timeframe, and why Class 7 is about combining them.
A practical rule: decide which timeframe holds your trade before you decide whether there is a trend. A trader who holds positions for a few days needs the daily trend first and the hourly trend second. A trader who holds for weeks needs the weekly trend first.
Why trends exist
If prices were a pure random walk, “trends” would be accidents: patterns we see in noise. Two kinds of evidence say there is more to it.
How information spreads. New information reaches people gradually, and people update their views gradually. A central bank’s change of direction, a company’s improving business or a shift in a country’s trade balance is absorbed over weeks and months, not in one tick. Investors also tend to sell winners too early and hold losers too long, which slows the adjustment. Each of these makes prices move toward a new level in steps rather than all at once.
What the data shows. Researchers have tested simple trend rules across many markets and long histories:
- Moving-average and breakout rules on the Dow Jones index showed returns that a random walk could not explain over most of the twentieth century (Brock, Lakonishok and LeBaron, 1992).
- Time-series momentum, meaning a market’s own return over the past year predicting its return over the next month, appeared across dozens of futures markets in currencies, stock indexes, bonds and commodities (Moskowitz, Ooi and Pedersen, 2012).
- Trend-following rules applied to more than a century of data showed positive average results in most decades, with the largest gains during big, extended moves (Hurst, Ooi and Pedersen, 2017).
Two cautions travel with that evidence. Trend rules lose money in choppy, range-bound periods, sometimes for long stretches. And the edge is small relative to the noise: it shows up over many trades and many markets, not on every chart. A trend read improves your odds; it does not tell you the future.
Most of the time, markets are not trending strongly
On most charts, most of the time, price is ranging or in transition. Strong, clean trends are less common than they look in hindsight, because the trends we remember are the big ones. That has a practical consequence: a good trend read spends much of its time saying “no trend”. A method that finds a trend on every chart is not reading trends; it is reading whatever it was told to see.
The four questions
Every trend read in this course answers four questions:
- Direction: up, down, or none?
- Timeframe: on which chart?
- Strength: how clean and persistent is it, compared with the noise?
- Status: is it starting, under way, or showing signs of ending?
| Question | Classes that answer it |
|---|---|
| Direction | 2 (structure), 3 (trendlines), 4 (moving averages), 10 (the ladder) |
| Timeframe | 7 (timeframes), 10 (the chain of boxes) |
| Strength | 5 (strength measures), 6 (momentum) |
| Status | 8 (how trends start and end), 6 (divergence) |
By the end of the course you will be able to write a trend read in one sentence, for example: “Daily uptrend, strong (efficiency ratio 0.55, ADX 31), under way; the weekly agrees; a pullback is in progress on the 4-hour.”
References
- Brock, W., Lakonishok, J., & LeBaron, B. (1992). Simple technical trading rules and the stochastic properties of stock returns. Journal of Finance, 47(5), 1731–1764.
- Moskowitz, T. J., Ooi, Y. H., & Pedersen, L. H. (2012). Time series momentum. Journal of Financial Economics, 104(2), 228–250.
- Hurst, B., Ooi, Y. H., & Pedersen, L. H. (2017). A century of evidence on trend-following investing. Journal of Portfolio Management, 44(1), 15–29.
2 Check yourself
7 questions. Pass mark 70%. Retake as often as you like; your best score counts.