Swing Structure
1 Read
Read the class below, including each diagram, then tick the box.
This course is free to read. Sign in to tick off each class, take the quizzes and earn the certificate.
What you will be able to do
- Mark swing highs and swing lows with a rule that gives the same answer every time.
- Define an uptrend and a downtrend by their swings.
- Recognize a break of structure, and tell it from a normal pullback.
- Avoid the most common ways swing reads become subjective.
Swings are the skeleton of a trend
Price never moves in a straight line. It moves in swings: a push in one direction, a pullback, another push. The turning points of those swings, the swing highs and swing lows, are the simplest and oldest way to read a trend.
The rule comes from Dow theory, developed from Charles Dow’s writing around 1900:
- An uptrend makes higher highs and higher lows: each push goes further than the last, and each pullback stops above the last one.
- A downtrend makes lower highs and lower lows.
- Anything else, such as higher highs with lower lows, or swings stuck between the same levels, is not a trend: it is a range or a transition.
Marking swings by rule
Swing reads go wrong when the swings are chosen by eye, because the eye finds what it hopes for. Use a fixed rule:
A swing high is a bar whose high is higher than the highs of the N bars on each side of it. A swing low is a bar whose low is lower than the lows of the N bars on each side.
With N = 2, a swing high needs two lower highs before it and two after it (this five-bar pattern is often called a fractal). A larger N finds fewer, bigger swings; a smaller N finds more, smaller ones.
| N | Swings found | Use it for |
|---|---|---|
| 1 | Many, including small wiggles | Very short-term reads |
| 2 | A balanced number | The default for most charts |
| 3 to 5 | Only the larger turns | Cleaner structure, later confirmation |
Two consequences of any swing rule:
- A swing is only confirmed N bars after it happens. With N = 2, today’s bar cannot be confirmed as a swing low until two more bars close above its low. Every structure read lags a little.
- Choose N once and keep it. Changing N chart by chart, until the structure says what you want, is the subjectivity this rule is meant to remove.
Many platforms can mark swings for you with a “ZigZag” or “fractals” study. Check how the platform defines a swing before you rely on it: some ZigZag studies redraw their last line as new bars arrive.
An uptrend, swing by swing
Daily EUR/USD, swings marked with N = 2:
| Swing | Type | Price | Compared with the previous swing of the same type |
|---|---|---|---|
| L1 | Low | 1.0800 | — |
| H1 | High | 1.0920 | — |
| L2 | Low | 1.0860 | Higher low (+60 pips) |
| H2 | High | 1.0990 | Higher high (+70 pips) |
| L3 | Low | 1.0930 | Higher low (+70 pips) |
| H3 | High | 1.1060 | Higher high (+70 pips) |
| L4 | Low | 1.0990 | Higher low (+60 pips) |
| H4 | High | 1.1040 | Lower high (−20 pips) |
| — | Close below L4 | 1.0985 | Break of structure |
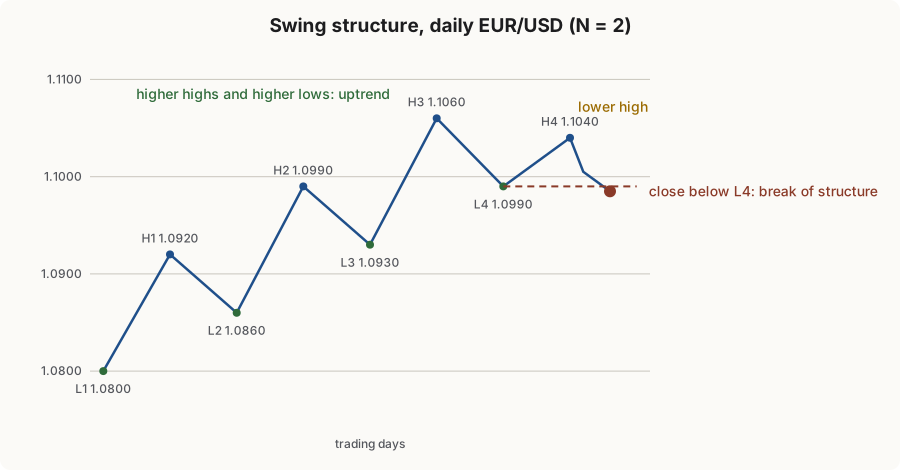
From L1 to H3 the read is clean: every high is higher and every low is higher. Uptrend.
Pullbacks are part of the trend
Each move from a swing high down to the next higher low (H1 to L2, H2 to L3, H3 to L4) is a pullback. In an uptrend, pullbacks are normal and expected; they are not a sign that the trend is ending. The trend is intact as long as the pullback stops above the last swing low.
How deep is normal? Measure each pullback as a share of the push before it:
- H1 to L2: the push L1 to H1 was 120 pips; the pullback was 60 pips: 50%.
- H2 to L3: push L2 to H2 = 130 pips, pullback 60 pips: 46%.
- H3 to L4: push L3 to H3 = 130 pips, pullback 70 pips: 54%.
This trend’s pullbacks run about half of each push. When a pullback is much deeper than the trend’s normal ones, the trend is weakening even if structure has not broken yet.
The break of structure
The trend’s structure ends in two steps:
- A lower high (H4 at 1.1040, below H3’s 1.1060). The push failed to make progress. This is a warning, not yet a reversal: many uptrends make one lower high and then resume.
- A close below the last higher low (below L4 at 1.0990). Now the defining rule of the uptrend, “each pullback stops above the last one”, has failed. This is the break of structure.
After a break of structure, the read is no longer an uptrend. It is not automatically a downtrend either. A downtrend needs its own lower high and lower low. Often what follows is a range, which Class 8 covers.
A useful discipline: use closes, not wicks, to judge a break. A wick below the last swing low that closes back above it is a test, not a break. (This is the same idea as the Outer Box’s outer thresholds, Class 10: the edge of a range is not broken until price is clearly through it.)
Keeping structure objective
- One swing rule (one N) per timeframe, written in your plan.
- One price for each judgment: highs and lows for marking swings, closes for judging breaks.
- Read only confirmed swings. The current bar is not a swing until N bars have closed after it.
- Name the timeframe. “Higher lows on the daily” is a read; “higher lows” is not.
Strengths and weaknesses
| Strengths | Weaknesses |
|---|---|
| Uses price alone, no settings except N | Lags: swings confirm late |
| Works on every market and timeframe | In ranges, gives frequent conflicting signals |
| Gives natural levels: the last swing low is where the trend read fails | A small change in N can change the read |
| The same idea underlies most other methods | Says little about strength |
2 Check yourself
7 questions. Pass mark 70%. Retake as often as you like; your best score counts.