Trendlines and Channels
1 Read
Read the class below, including each diagram, then tick the box.
This course is free to read. Sign in to tick off each class, take the quizzes and earn the certificate.
What you will be able to do
- Draw a trendline that follows a rule rather than your hopes.
- Use the slope of a trendline as a measure of the trend’s pace.
- Read a trendline break correctly: as a change of pace, a warning, or a reversal.
- Draw a channel and read overshoots.
- Use a linear regression channel when you want no judgment at all.
Drawing a trendline by rule
A trendline joins swing points (Class 2) to show the trend’s path.
- An uptrend line joins two or more swing lows, and is drawn below price.
- A downtrend line joins two or more swing highs, and is drawn above price.
Rules that keep trendlines honest:
- Use confirmed swings only, marked with your usual N.
- Two points draw a line; a third confirms it. Any two swings can be joined. A line that a later swing touches (within a few pips or ticks) and holds is one the market is respecting.
- Be consistent about wicks or bodies. Drawing through the lows (wicks) is the common choice; whichever you choose, use it everywhere.
- The line must not cut through prices between the points. If it slices through candles, it does not describe the trend.
- On long-term charts, use a logarithmic price scale, so that a steady percentage trend appears as a straight line.
A trendline in numbers
Using the EUR/USD swings from Class 2, numbered by trading day:
| Swing | Day | Price |
|---|---|---|
| L1 | 0 | 1.0800 |
| H1 | 5 | 1.0920 |
| L2 | 10 | 1.0860 |
| H2 | 15 | 1.0990 |
| L3 | 20 | 1.0930 |
| H3 | 25 | 1.1060 |
| L4 | 30 | 1.0990 |
| H4 | 35 | 1.1040 |
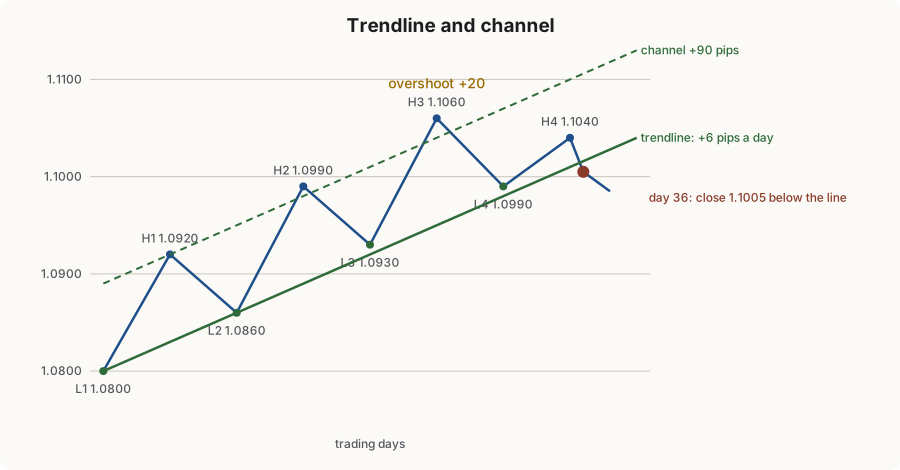
Draw the line through L1 and L2: it rises 60 pips in 10 days, a slope of 6 pips a day:
line value on day d = 1.0800 + 0.0006 × d
Confirm it: on day 20 the line is at 1.0800 + 0.0120 = 1.0920. L3 formed at 1.0930, 10 pips above the line: the third touch held. The line is confirmed.
Check it again: on day 30 the line is at 1.0980. L4 formed at 1.0990, again just above. Four touches: the market is respecting a pace of about 6 pips a day.
The slope is the pace
A trendline’s slope tells you how fast the trend is moving. Compare it with the market’s normal daily range:
- A gentle line (a small slope compared with the daily range) describes a sustainable trend with room for pullbacks.
- A very steep line describes a fast trend. Fast trends exist, but they rarely keep their pace; steep lines are broken sooner.
When a steep line breaks and price continues the trend at a gentler slope, draw the new line from the new swing lows. A series of lines, each flatter than the last (a fan), shows a trend losing pace. A third, flatter line breaking is a classic sign that the trend is ending.
Reading a break
On day 36, the line is at 1.0800 + 0.0216 = 1.1016. Price closes at 1.1005: below the line. That is a trendline break, and it comes before the structure break (the close below L4 at 1.0990 in Class 2).
A trendline break can mean three different things:
| Meaning | What follows | How common |
|---|---|---|
| Change of pace | The trend continues at a gentler slope; a new, flatter line is drawn | Common |
| Change to a range | Price stops making progress and moves sideways | Common |
| Reversal | A downtrend begins: lower highs and lower lows | Less common, and only confirmed by structure |
So a trendline break is a warning that the pace has changed. It is earlier than a structure break, and less reliable. Treat it as a reason to tighten your management, not as proof that the trend is over. Confirm with structure (Class 2) and the other methods in this course.
After a break, price often retests the line from the other side: it rallies back to the underside of the broken uptrend line and fails there. A failed retest strengthens the case that the trend has changed.
Channels
A channel adds a second line, parallel to the trendline, through the swing highs (for an uptrend). It frames the trend’s normal swings.
In the example, the parallel through H1 (day 5, 1.0920) sits 90 pips above the trendline (on day 5 the trendline is at 1.0830). The channel’s upper line on day 25 is at 1.0950 + 0.0090 = 1.1040.
- Inside the channel: the trend is moving at its normal pace and with its normal swings.
- An overshoot of the upper line: H3 reached 1.1060, 20 pips above the channel. The trend is accelerating. Overshoots near the end of a long trend are often signs of exhaustion: buyers are paying up in a hurry.
- Failing to reach the upper line: H4 at 1.1040 stopped well below the upper line, which on day 35 was at 1.1100. A push that falls short of the channel is the channel’s version of a lower high: momentum is fading.
The regression channel: no judgment at all
If you want a trendline nobody can argue with, use a linear regression line: the straight line that best fits the closes over a fixed number of bars (for example, 50). Most platforms draw one, with parallel lines one or two standard deviations above and below it.
- Its slope is the trend’s average pace over the window.
- Its fit (the R², Class 5) says how well a straight line describes the prices: a high fit is a clean trend; a low fit is noise or a range.
- It moves with every new bar, so it is a summary of the recent past rather than a line the market “respects”.
Hand-drawn trendlines show where the market has reacted; regression channels measure the trend without opinion. Many traders use both.
Strengths and weaknesses
| Strengths | Weaknesses |
|---|---|
| Shows pace as well as direction | Two points can always be joined: easy to fool yourself |
| Breaks warn earlier than structure | Breaks are often changes of pace, not reversals |
| Gives a level that moves with the trend | Depends on wick-or-body and scale choices |
| Channels show normal swing size and overshoots | Redrawing a broken line until it “holds” defeats its purpose |
2 Check yourself
7 questions. Pass mark 70%. Retake as often as you like; your best score counts.