Moving Averages as a Trend Read
1 Read
Read the class below, including each diagram, then tick the box.
This course is free to read. Sign in to tick off each class, take the quizzes and earn the certificate.
What you will be able to do
- Calculate a simple and an exponential moving average, and explain the difference.
- Read a trend from an average three ways: its slope, price’s position, and crossovers.
- Combine the reads into one of three regimes: uptrend, downtrend or no trend.
- Explain lag and whipsaw, and choose an average length that fits your timeframe.
- Measure how stretched price is from its average.
A moving average smooths the noise
A moving average is the average closing price over the last n bars, recalculated each bar. It irons out the back-and-forth so the direction underneath shows.
- Simple moving average (SMA): the plain average of the last n closes.
- Exponential moving average (EMA): a weighted average that counts recent closes more. Each bar: EMA = close × k + previous EMA × (1 − k), where k = 2 ÷ (n + 1).
Example: the last eleven daily closes of a rising EUR/USD:
| Day | 0 | 1 | 2 | 3 | 4 | 5 | 6 | 7 | 8 | 9 | 10 |
|---|---|---|---|---|---|---|---|---|---|---|---|
| Close | 1.1000 | 1.1030 | 1.1010 | 1.1050 | 1.1040 | 1.1080 | 1.1070 | 1.1110 | 1.1100 | 1.1140 | 1.1150 |
| 5-day SMA | 1.1026 | 1.1042 | 1.1050 | 1.1070 | 1.1080 | 1.1100 | 1.1114 | ||||
| 5-day EMA | 1.1000 | 1.1010 | 1.1010 | 1.1023 | 1.1029 | 1.1046 | 1.1054 | 1.1073 | 1.1082 | 1.1101 | 1.1117 |
On day 4 the SMA is (1.1000 + 1.1030 + 1.1010 + 1.1050 + 1.1040) ÷ 5 = 1.1026. The closes zigzag; both averages climb steadily. The EMA (k = 2 ÷ 6 = 0.333) ends slightly closer to the latest close than the SMA does, because it weights recent prices more.
Indicators Through the Outer Box covers averages in detail. Here they answer one question: is there a trend?
Three trend reads from an average
1. Slope. Is the average rising, falling or flat? Measure it, rather than eyeballing: the change in the average over a fixed number of bars.
A 50-day SMA at 1.0950 today and 1.0890 ten days ago has risen 60 pips in 10 days.
A rising average says closes have been higher on balance over its window; a flat one says they have not.
2. Price position. Is price above or below the average? Above a rising average, the recent prices are stronger than the window’s average: consistent with an uptrend.
3. Crossover. When a faster average (say 50 days) crosses above a slower one (say 200 days), the recent trend has turned up relative to the longer one. On daily stock index charts these are popularly called the golden cross (50 above 200) and death cross (50 below 200). Crossovers are slow, late signals, which is both their strength (few false signals in strong trends) and their weakness (they arrive well after the turn).
Combining the reads into a regime
| Price vs average | Average’s slope | Regime |
|---|---|---|
| Above | Rising | Uptrend |
| Below | Falling | Downtrend |
| Above | Falling, or below and rising | Transition: price and the average disagree |
| Crossing back and forth | Flat | No trend (range) |
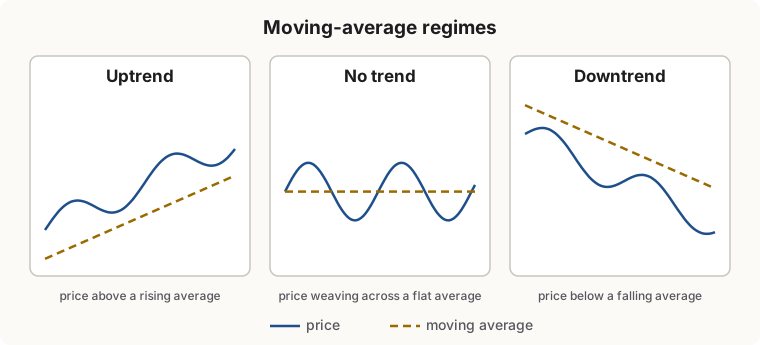
Use the regime, not a single read. Price above an average that is still falling is often the first sign of a turn, but it is not yet an uptrend; wait for the slope to agree.
Lag: the price of smoothness
An average is made of past prices, so it is always late. A simple moving average of n bars lags price by about (n − 1) ÷ 2 bars: about 10 bars for a 21-bar SMA, about 100 bars for a 200-bar SMA. An EMA of the same length lags less.
The trade-off cannot be avoided:
| Shorter average | Longer average |
|---|---|
| Turns sooner | Turns later |
| Follows smaller trends | Shows only large trends |
| More false signals in ranges | Fewer false signals |
Whipsaw: averages in a range
In a range, price crosses a flat average again and again. Every cross looks like a new trend and is not. This is called whipsaw, and it is where moving-average rules lose most of their money. Two defenses:
- Require the slope to agree (the regime table above): a flat average gives no trend read at all.
- Check strength first (Class 5): if the market is not trending, do not read crosses.
Choosing a length
Match the average to the trend you want to read, not to what someone else uses:
| Trend you want | Daily chart average |
|---|---|
| Short-term (days to a few weeks) | 10 to 21 bars |
| Intermediate (weeks to months) | 50 bars |
| Long-term (months to years) | 100 to 200 bars |
Common lengths (20, 50, 200 on daily charts) have one extra property: many traders watch them, so price sometimes reacts at them. Pick one or two, write them in your plan and keep them; changing the length until the chart agrees with you is the same mistake as redrawing trendlines.
How stretched is price?
In a strong trend, price can move far from its average, and very far moves tend to be followed by pullbacks or pauses. Measure the distance in units of the market’s normal range, the average true range (ATR), so it means the same thing on every market:
stretch = (price − average) ÷ ATR
Example: price 1.1040, 50-day SMA 1.0950, 14-day ATR 60 pips: (1.1040 − 1.0950) ÷ 0.0060 = 1.5 ATRs above the average.
There is no magic number, but on a given market you can see from history how far its trends usually stretch before pausing. A trend that keeps stretching further than its past trends is accelerating; that is often strong, and late in a move it can be exhaustion (Class 8).
Strengths and weaknesses
| Strengths | Weaknesses |
|---|---|
| Fully objective once the length is chosen | Always late |
| Works on every market and timeframe | Whipsaws in ranges |
| The regime table gives a clear yes or no | Says little about strength on its own |
| Stretch shows when a trend is extended | Different lengths can give different reads |
2 Check yourself
7 questions. Pass mark 70%. Retake as often as you like; your best score counts.