Measuring Trend Strength
1 Read
Read the class below, including each diagram, then tick the box.
This course is free to read. Sign in to tick off each class, take the quizzes and earn the certificate.
What you will be able to do
- Calculate the efficiency ratio of any stretch of prices.
- Use the slope and fit (R²) of a regression line as a measure of trend quality.
- Read ADX and the directional indicators correctly, including what they do not tell you.
- Use ATR and range expansion to see whether a move is unusual for that market.
- Combine the measures into a strength score you can apply the same way every time.
Why measure strength
Classes 2 to 4 answer “which direction?”. They do not say whether the trend is strong enough to trade. A market that rises 20 pips over two weeks while swinging 100 pips a day has a “direction” and no useful trend. Strength measures compare progress with noise.
All the examples use two stretches of eleven daily EUR/USD closes:
| Day | 0 | 1 | 2 | 3 | 4 | 5 | 6 | 7 | 8 | 9 | 10 |
|---|---|---|---|---|---|---|---|---|---|---|---|
| A (trending) | 1.1000 | 1.1030 | 1.1010 | 1.1050 | 1.1040 | 1.1080 | 1.1070 | 1.1110 | 1.1100 | 1.1140 | 1.1150 |
| B (choppy) | 1.1000 | 1.1040 | 1.0990 | 1.1050 | 1.0980 | 1.1030 | 1.0990 | 1.1060 | 1.1000 | 1.1040 | 1.1020 |
The efficiency ratio
Perry Kaufman’s efficiency ratio (ER) asks: of all the distance price travelled, how much was progress?
ER = |last close − first close| ÷ sum of |each close-to-close change|
Series A: net change 1.1150 − 1.1000 = 150 pips. The ten daily changes are +30, −20, +40, −10, +40, −10, +40, −10, +40, +10: their sizes add up to 250 pips.
ER = 150 ÷ 250 = 0.60
Series B: net change 1.1020 − 1.1000 = 20 pips. Its daily changes (+40, −50, +60, −70, +50, −40, +70, −60, +40, −20) add up to 500 pips.
ER = 20 ÷ 500 = 0.04
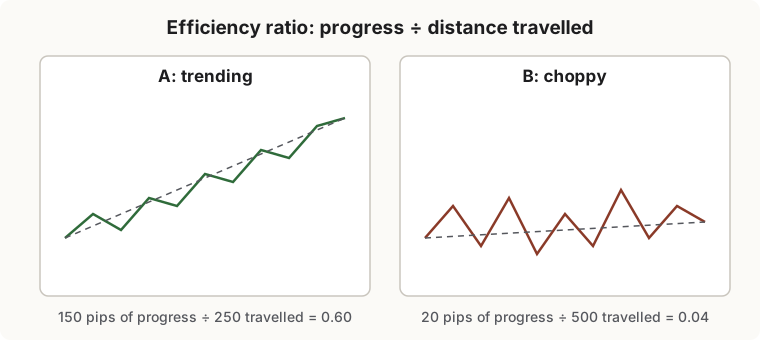
ER runs from 0 (no net progress at all) to 1 (a straight line with no pullbacks). As a guide on daily charts with a 10-bar window:
| ER | Reading |
|---|---|
| Above about 0.5 | Strong, efficient trend |
| About 0.3 to 0.5 | Trend with normal pullbacks |
| Below about 0.2 | No useful trend: range or chop |
The thresholds are rough; check them against the markets you trade. ER’s great virtue is that it needs nothing but closes and is easy to calculate by hand or in a spreadsheet.
Slope and fit of a regression line
Fit a straight line to the closes (Class 3’s regression line) and read two numbers:
- Slope: the average progress per bar.
- R² (fit): how much of the movement the straight line explains, from 0 to 1.
| Slope | R² | |
|---|---|---|
| Series A | +14.6 pips a day | 0.93 |
| Series B | +1.5 pips a day | 0.03 |
A high R² with a meaningful slope is a clean trend. A low R² means a straight line is a poor description: whatever the slope, the market is mostly noise. Many platforms offer a “linear regression slope” or “R-squared” study; spreadsheets calculate both with the SLOPE and RSQ functions.
ADX and the directional indicators
J. Welles Wilder introduced the Average Directional Index (ADX) in 1978. It is one of the most widely used trend-strength measures, and one of the most misread.
How it is built, in outline (your platform does the arithmetic):
- Each bar, the directional movements: +DM is how much today’s high exceeds yesterday’s high; −DM is how much today’s low is below yesterday’s low (only the larger one counts each bar).
- Each is divided by the average true range and smoothed over 14 bars, giving +DI and −DI: the share of recent range that was upward and downward movement.
- DX = |+DI − −DI| ÷ (+DI + −DI) × 100. Example: +DI = 32, −DI = 14 gives DX = 18 ÷ 46 × 100 = 39.
- ADX is DX smoothed over 14 bars.
How to read it:
- ADX measures strength, not direction. A strong downtrend has a high ADX too. Direction comes from +DI vs −DI: +DI above −DI points up, −DI above +DI points down.
- Rough levels: below about 20, no meaningful trend; above about 25, a trend is present; a rising ADX means the trend is strengthening, a falling ADX means it is weakening (even if price is still rising).
- ADX is slow. It is smoothed twice, so it confirms trends that are already well under way and stays high for a while after they stall.
Range expansion and ATR
The average true range (ATR), also Wilder’s, is the average size of each bar’s full range, including gaps from the previous close. It measures noise, not direction, but trends often begin with range expansion:
- Bars that are larger than the recent ATR, closing near their extremes, in the direction of the new move, show conviction.
- A long stretch of shrinking ranges (ATR falling) often comes before a breakout: the market is compressing.
ATR is also the ruler used throughout this course: stretch from the average (Class 4), trailing stops (Class 9) and the size of a “big” move all use it.
A strength scorecard
No single measure is enough; each fails in a different way. Score three, for the timeframe you are reading:
| Measure | 0 points | 1 point | 2 points |
|---|---|---|---|
| Efficiency ratio (10 bars) | Below 0.2 | 0.2 to 0.5 | Above 0.5 |
| ADX (14) | Below 20 | 20 to 25 | Above 25 and rising |
| Structure (Class 2) | Mixed swings | Higher highs or higher lows (not both) | Higher highs and higher lows |
| Total | Read |
|---|---|
| 0 to 2 | No trend. Range tactics, or stand aside |
| 3 to 4 | Weak or developing trend. Trade with it only from good levels, at reduced size |
| 5 to 6 | Strong trend. Trend tactics (Class 9) |
Write the score in your journal with every trade. After a few dozen trades you will see which score levels actually worked for you.
Strengths and weaknesses
| Measure | Strength | Weakness |
|---|---|---|
| Efficiency ratio | Simple, objective, uses closes only | Sensitive to the window length |
| Regression R² | Clean measure of how linear the move is | Says nothing about the last few bars |
| ADX | Widely available; separates strength from direction | Slow; high after the trend has already stalled |
| ATR / range | Shows conviction and compression | No direction on its own |
2 Check yourself
7 questions. Pass mark 70%. Retake as often as you like; your best score counts.