Momentum and Divergence
1 Read
Read the class below, including each diagram, then tick the box.
This course is free to read. Sign in to tick off each class, take the quizzes and earn the certificate.
What you will be able to do
- Calculate rate of change and RSI, and say what each measures.
- Use RSI ranges to tell a trending market from a ranging one.
- Read MACD’s position and slope as a trend confirmation.
- Spot regular divergence and treat it as a warning, not a signal.
- Spot hidden divergence inside a trend.
Momentum is the speed of the trend
Direction says where price is going; momentum says how fast. A trend can keep its direction while its speed fades, and fading speed often comes before a change of direction. That is why momentum is useful for the fourth question of a trend read: status (Class 1).
Rate of change
The simplest momentum measure:
rate of change (ROC) = (close today ÷ close n bars ago − 1) × 100
EUR/USD closes at 1.1150 today and closed at 1.0950 twenty days ago: (1.1150 ÷ 1.0950 − 1) × 100 = +1.83% over 20 days. Positive and rising ROC: the trend is gaining speed. Positive and falling: still up, but slowing.
RSI
Wilder’s Relative Strength Index compares the average size of up-closes with the average size of down-closes over 14 bars:
RS = average gain ÷ average loss; RSI = 100 − 100 ÷ (1 + RS)
If, over the last 14 days, the average up-day gained 30 pips and the average down-day lost 15 pips: RS = 2, RSI = 100 − 100 ÷ 3 = 66.7.
RSI runs from 0 to 100. Textbooks call above 70 “overbought” and below 30 “oversold”.
RSI ranges: the trend read hidden in RSI
In a strong trend, “overbought” is not a sell signal. It is what a trend looks like. A market in a strong uptrend can hold RSI above 70 for weeks while price keeps climbing. Selling every 70 reading in an uptrend means selling into the trend again and again.
Technicians including Andrew Cardwell and Constance Brown observed that RSI shifts its range with the trend:
| Market state | RSI tends to range | What it means |
|---|---|---|
| Uptrend | About 40 to 80 | Pullbacks bottom near 40 to 50; pushes reach 70 or more |
| Downtrend | About 20 to 60 | Rallies stall near 50 to 60; falls reach 30 or less |
| Range | About 30 to 70, crossing 50 often | No side dominates |
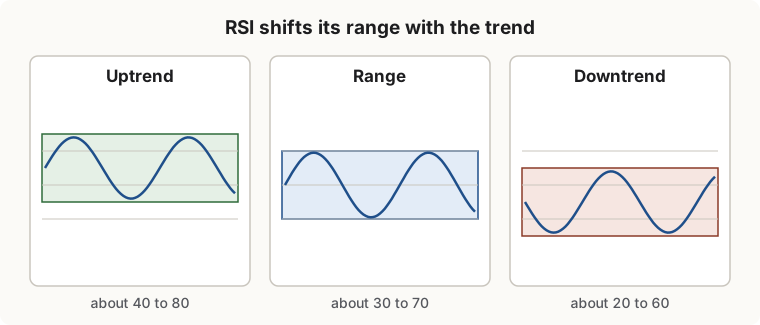
This turns RSI into a trend read:
- RSI pullbacks that hold above 40 while pushes reach 70 say the uptrend is intact.
- An RSI pullback that breaks below 40, followed by a push that fails to reach 60, says the uptrend’s range has been lost: the market is shifting toward a range or a downtrend.
MACD
MACD is the difference between a 12-bar and a 26-bar EMA, with a 9-bar EMA of that difference as its signal line. As a trend read:
- MACD above zero means the shorter average is above the longer one: the recent trend is up. Below zero, down.
- MACD rising means the gap is widening: the trend is gaining speed. Falling: losing speed.
- Crossing the signal line is a short-term timing signal; it says more about the latest swing than about the trend.
For trend identification, the zero line matters most: a market whose MACD stays above zero through its pullbacks is in an uptrend on that timeframe.
Regular divergence: the trend is tiring
Regular divergence is when price and momentum disagree at the extremes:
- Bearish divergence: price makes a higher high, but momentum (RSI, MACD or ROC) makes a lower high. The new high was reached with less force than the last one.
- Bullish divergence: price makes a lower low, but momentum makes a higher low.
Example. EUR/USD makes a swing high at 1.1060 with RSI at 74. After a pullback it makes a new high at 1.1085, but RSI peaks at only 63. Price went 25 pips further on noticeably less momentum: bearish divergence.
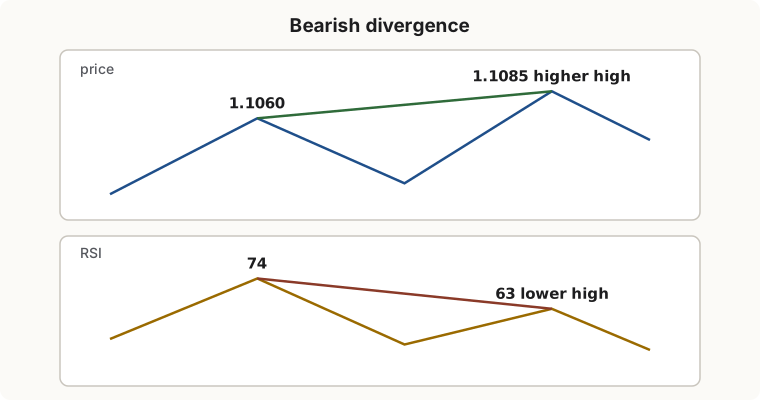
How to use it:
- It is a warning, not a signal. Strong trends often show two or three divergences before they turn, and some never turn at all. Divergence says “the trend is tiring”, not “sell now”.
- Wait for price to confirm. The confirmation is in price: a break of structure (Class 2), a trendline break (Class 3), or a regime change on the average (Class 4).
- Act on it in your management, not your direction. Divergence is a good reason to take partial profits, tighten a trailing stop, or avoid adding to a position. It is a poor reason to trade against the trend on its own.
Hidden divergence: the trend is continuing
Hidden divergence runs the other way and appears inside a trend’s pullbacks:
- Bullish hidden divergence: price makes a higher low (the uptrend’s structure holds), while momentum makes a lower low (the pullback felt deep).
The momentum dip looked alarming, but price held above its last low: the trend absorbed the selling. It is a continuation sign, often found where trend traders look to buy pullbacks (Class 9).
Momentum in the trend read
| Momentum shows | Add to the trend read |
|---|---|
| RSI holding its trend range; MACD on the trend’s side of zero | Trend confirmed |
| Regular divergence at a new extreme | Trend tiring: watch price for confirmation |
| RSI loses its trend range; MACD crosses zero | Trend in transition |
| Hidden divergence at a higher low | Trend continuing after a pullback |
2 Check yourself
7 questions. Pass mark 70%. Retake as often as you like; your best score counts.