Trends Across Timeframes
1 Read
Read the class below, including each diagram, then tick the box.
This course is free to read. Sign in to tick off each class, take the quizzes and earn the certificate.
What you will be able to do
- Explain how trends nest inside each other.
- Choose three timeframes that work together for the way you trade.
- Give each timeframe a job: direction, trading or entry.
- Name the four combinations of a larger and a smaller trend, and what each one means for a trade.
- Write a three-timeframe trend read.
Trends nest
Every trend on a larger chart is built from swings on a smaller chart. A weekly uptrend is a series of daily pushes and daily pullbacks. Each daily pullback is a small downtrend on the 4-hour chart. Each 4-hour push is a series of hourly swings.
A classic way to picture it, popularized by Alexander Elder: the larger trend is the tide, the next one down is the waves, and the smallest is the ripples. You can swim against a ripple without much trouble; swimming against the tide is exhausting.
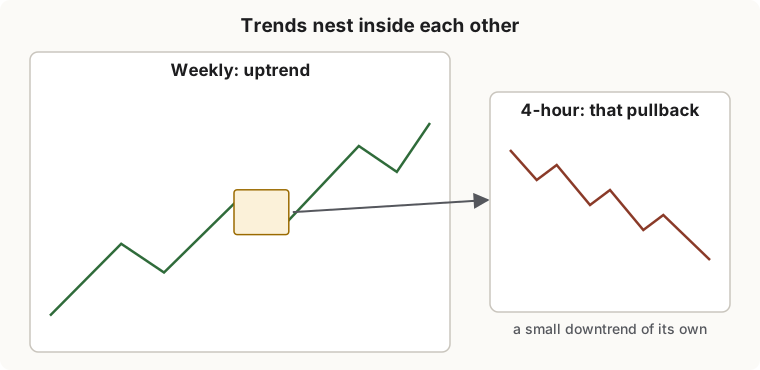
This is why the same moment can show an uptrend, a range and a downtrend on three charts (Class 1). Nothing is contradictory: you are looking at the tide, a wave and a ripple.
Choose three timeframes
Use three timeframes, each about four to six times the next smaller one. Elder’s Triple Screen method used a factor of about five. Common sets:
| How long you hold trades | Direction (largest) | Trading | Entry (smallest) |
|---|---|---|---|
| Weeks to months | Monthly | Weekly | Daily |
| Days to a few weeks | Weekly | Daily | 4-hour |
| Hours to a few days | Daily | 4-hour | 1-hour |
| Within the day | 4-hour | 1-hour | 15-minute |
A gap of about five keeps each chart meaningfully different from the next: close enough that the smaller trend is a part of the larger one, far enough apart that they do not just repeat each other.
Give each timeframe a job
| Timeframe | Its question | Its job |
|---|---|---|
| Direction (largest) | Which way is the tide? | Decides which side you prefer |
| Trading (middle) | Is this a push, a pullback or a range? | Decides whether a setup exists |
| Entry (smallest) | Has the move in my favor started? | Decides when to act and where the stop goes |
The larger chart outranks the smaller. When they disagree, the smaller chart’s trend is usually a pullback or a counter-move inside the larger one, and the larger trend is more likely to resume than the smaller one is to take over. That is not a law, but it is the base rate to start from.
The four combinations
Compare the direction timeframe with the trading timeframe:
| Direction trend | Trading trend | What it is | What it usually means |
|---|---|---|---|
| Up | Up | Aligned uptrend | Trend trade: buy pullbacks on the entry chart |
| Up | Down | Pullback in an uptrend | Setup forming: wait for the trading chart to turn back up |
| Down | Up | Rally in a downtrend | Counter-trend: either stand aside or wait for it to fail |
| Down | Down | Aligned downtrend | Trend trade: sell rallies on the entry chart |
If the direction timeframe has no trend, there is no tide: trade the range on the trading timeframe, or stand aside.
The most attractive trend trades usually come from row 2 (or its mirror in a downtrend): the larger trend is intact, the smaller chart has pulled back, and the smaller chart is just turning back in the larger trend’s direction. Class 9 shows how to enter there.
A worked three-timeframe read
A swing trader who holds positions for days uses weekly, daily and 4-hour.
| Timeframe | Structure (Class 2) | Average (Class 4) | Efficiency ratio (Class 5) | ADX | Read |
|---|---|---|---|---|---|
| Weekly | Higher highs and higher lows for 8 weeks | Above a rising 20-week average | 0.48 | 29 | Uptrend, strong |
| Daily | Lower high, then a lower low over 4 days | Price just below the 20-day average, average flattening | 0.22 | 18 | Pullback |
| 4-hour | Has just made a higher low and broken above its last lower high | Price back above a turning 20-bar average | 0.41 | 22 | Turning up |
The one-sentence read:
Weekly uptrend, strong; daily pulling back, now near its 20-day average; 4-hour has just turned up. A pullback in an uptrend, with the entry chart turning in the direction of the tide.
That is row 2 of the table above, with the entry timeframe confirming. The same tools, applied to each chart, produce a read that is far more useful than any single chart’s.
When the timeframes are a mess
Sometimes the direction chart has no trend, the trading chart is choppy and the entry chart flips every few hours. The correct read is “no trend”. A trader who must trade every day will force a trend read onto a chart that has none; a trader with a plan will either trade the range with range tactics or wait. Recognizing that there is nothing to read is a skill, not a failure.
Strengths and weaknesses of the multi-timeframe read
| Strengths | Weaknesses |
|---|---|
| Puts every trend in context: tide, wave, ripple | Three charts give three chances to see what you want |
| Turns pullbacks into setups instead of scares | Larger timeframes change slowly and can be late at turning points |
| The larger chart supplies the base rate | Needs fixed timeframes and fixed rules to stay objective |
2 Check yourself
7 questions. Pass mark 70%. Retake as often as you like; your best score counts.