How Trends Start and End
1 Read
Read the class below, including each diagram, then tick the box.
This course is free to read. Sign in to tick off each class, take the quizzes and earn the certificate.
What you will be able to do
- Name the phases of a trend and recognize each on a chart.
- Recognize how a new trend begins: compression, breakout, follow-through and the first higher low.
- List the signs that a trend is ending, and put them in the order they usually arrive.
- Tell a warning from evidence and evidence from confirmation.
The phases of a trend
Two old descriptions still fit most trends well.
Dow theory describes three phases of a major trend:
- Accumulation: informed buyers start buying while the news is still poor and most people are not interested. Price stops falling and moves sideways.
- Public participation: the improvement becomes visible, trend followers join, and price rises steadily. This is the longest and most tradable phase.
- Excess (or distribution): the news is excellent, everyone is talking about it, latecomers buy at any price, and early buyers sell to them.
Richard Wyckoff described the whole cycle in four stages: accumulation (a range at the bottom), markup (the uptrend), distribution (a range at the top) and markdown (the downtrend).
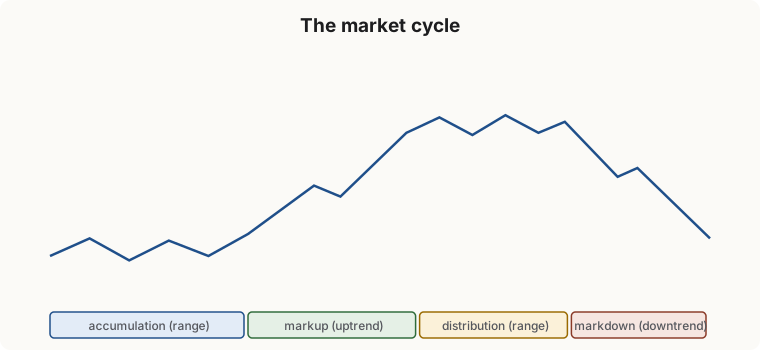
The practical lesson is in the shape: trends are born from ranges and usually die into ranges. Sharp V-shaped reversals happen, but most trends pause, go sideways, and only then either resume or turn.
How a trend starts
From a range, the start of an uptrend usually comes in four steps:
- Compression. The range narrows and the ATR falls (Class 5). The market is coiling.
- Breakout with range expansion. Price closes beyond the top of the range on a bar larger than recent bars, closing near its high.
- Follow-through. The next few bars hold beyond the breakout level instead of falling straight back in. A breakout that is fully reversed within a bar or two is a false breakout.
- The first higher low. The first pullback stops above the old range top, or at least well above the last low, and price makes a new high after it. Now there is structure: a higher low and a higher high (Class 2).
Each step adds evidence. A trader who acts at step 2 gets the best price and the most false signals; one who waits for step 4 gets a worse price and more confirmation. Neither is wrong; decide in advance which you will use.
The warning signs of an ending
Trends rarely end without some of these signs. None is enough on its own.
| Sign | What it looks like | Class |
|---|---|---|
| Momentum divergence | Price makes a new high; RSI or MACD does not | 6 |
| Overshoot or climax | Price leaps above its channel or stretches unusually far from its average, often on the trend’s largest bars | 3, 4 |
| Reversal bar | A bar makes a new high and then closes below the previous bar’s close | — |
| Loss of pace | Trendlines fan out, each flatter than the last; ADX turns down | 3, 5 |
| Failure to make progress | A lower high in an uptrend | 2 |
| Break of structure | A close below the last higher low | 2 |
| Regime change | Price below a flattening or falling average | 4 |
| RSI loses its trend range | Pullback below 40, then a rally that fails under 60 | 6 |
Warning, evidence, confirmation
The signs arrive in a typical order, and they carry different weight:
- Warnings (divergence, overshoot, reversal bar): the trend is tiring. Manage the position more tightly; do not trade against the trend yet.
- Evidence (loss of pace, lower high, trendline break): the trend has changed character. Stop adding in the trend’s direction; take profits.
- Confirmation (break of structure, regime change, RSI range lost): the trend, as defined, is over. Treat the market as a range until a new trend proves itself.
The EUR/USD example, from start to end
The swings from Classes 2 and 3, as one story:
| Day | What happened | Category |
|---|---|---|
| 0 to 20 | Higher lows at 1.0800, 1.0860, 1.0930; higher highs at 1.0920, 1.0990; trendline confirmed at 6 pips a day | Trend under way |
| 25 | High at 1.1060, 20 pips above the channel: an overshoot | Warning |
| 30 | Pullback holds at 1.0990, on the trendline: the trend is intact | — |
| 35 | Push stops at 1.1040: a lower high, well short of the channel top at 1.1100 | Evidence |
| 36 | Close at 1.1005, below the trendline (1.1016 that day): pace has changed | Evidence |
| 38 | Close at 1.0985, below the last higher low (1.0990): break of structure | Confirmation |
| 40 onward | Price chops between about 1.0950 and 1.1040: a range | Transition |
A trader managing a long position would have tightened at day 25, taken profits by day 36 and been fully out on day 38. A trader who sold short on day 25 because of the overshoot would have been nearly two weeks early, fighting a trend that was still intact.
Ranges first, reversals second
After a confirmed ending, the most common outcome is a range, not an immediate trend in the other direction. A new downtrend needs its own evidence: a lower high, a lower low, a falling average, RSI moving into its downtrend range. Until then, the honest read is “no trend”: use range tactics or wait for the next trend to prove itself.
Strengths and weaknesses
| Strengths | Weaknesses |
|---|---|
| Phases explain why ranges and trends alternate | Phases are clear in hindsight, less so in real time |
| The warning-evidence-confirmation order prevents both early exits and late ones | Some trends end with a sudden gap and no warnings |
| Combines every method in the course into one sequence | Each sign can appear and then be overridden by a resumed trend |
2 Check yourself
7 questions. Pass mark 70%. Retake as often as you like; your best score counts.