Trading With the Trend
1 Read
Read the class below, including each diagram, then tick the box.
This course is free to read. Sign in to tick off each class, take the quizzes and earn the certificate.
What you will be able to do
- Enter a trend on a pullback or on a breakout, with a rule for each.
- Place the initial stop where the trend read is wrong.
- Trail the exit by structure, by moving average, or by ATR.
- Size the trade by the stop, and decide whether to add to a winner.
- Explain why a sound trend strategy can lose more often than it wins and still make money.
Two ways in
Pullback entries
Wait for the trend to pull back, then enter when the pullback ends. This is the setup from Class 7: the direction and trading charts in an uptrend, a pullback on the trading chart, and the entry chart turning back up.
Where pullbacks tend to end (zones, not exact prices):
- near the last swing high that was broken (old resistance becoming support);
- at a rising trendline (Class 3);
- at a rising moving average the trend has respected (Class 4);
- after a retracement similar to the trend’s earlier ones (the 50%-ish pullbacks in Class 2).
The trigger is on the entry chart: a higher low, then a close above the entry chart’s last lower high. Do not buy just because price reached a zone; wait for evidence that the pullback has ended.
| Pullback entries | |
|---|---|
| Strengths | Better price; tighter stop; buys with the trend after weak hands have sold |
| Weaknesses | Some trends never pull back enough to enter; a pullback can turn into a reversal |
Breakout entries
Enter when price breaks to a new high for a set period, such as the highest close of the last 20 or 55 days. This is the classic trend-following entry: the “Turtle” traders trained by Richard Dennis in the 1980s used 20-day and 55-day breakouts. A breakout from a range (Class 8) is the same idea.
| Breakout entries | |
|---|---|
| Strengths | Never misses a big trend; fully objective |
| Weaknesses | Worse price; many false breakouts in ranges; wider stops |
Neither is better in general. Pullback entries suit traders who read structure; breakout entries suit traders who want a rule they can follow without judgment. Choose one per strategy and test it.
The initial stop
Put the stop where the trend read is wrong, not where the loss feels comfortable:
- Pullback entry: beyond the pullback’s low, the higher low that should hold if the trend is intact, plus a buffer (for example a quarter of an ATR) so a wick does not take you out.
- Breakout entry: back inside the range, beyond the level that would make the breakout false; or a fixed multiple of ATR (2 to 3 ATRs is common for daily breakouts).
The Outer Box version of the same idea, the stop beyond the outer threshold rather than just past the level, is in Class 10.
Trailing the exit
Trends end; the exit has to follow the trend and close the trade when the trend read fails. Three common trails:
| Trail | Rule (uptrend) | Character |
|---|---|---|
| Structure | Move the stop below each new higher low as it is confirmed | Follows the trend’s own definition; exits at the break of structure |
| Moving average | Exit on a close below the average (for example, the 20-day) | Simple; exits on regime change; gives back more in fast trends |
| ATR (chandelier) | Stop = highest high since entry − 3 × ATR | Adjusts to volatility; popularized by Chuck LeBeau |
Never move a stop away from price. A trail only tightens.
A worked trade
Daily EUR/USD, the swings from Class 2. The weekly chart is in an uptrend (direction), and the 4-hour chart is the entry chart.
- Setup. After H1 (1.0920), the daily pulls back to L2 (1.0860): a 50% retracement, at the rising trendline’s start.
- Trigger. The 4-hour makes a higher low and closes above its last lower high. Entry: 1.0875.
- Initial stop: below L2 at 1.0860, with a 15-pip buffer: 1.0845. Risk = 30 pips.
- Size: a $25,000 account risking 1% = $250. On EUR/USD a standard lot is $10 a pip, so 30 pips is $300 a lot: 250 ÷ 300 = 0.83 lots.
- Trail by structure:
- L3 confirmed at 1.0930 → stop to 1.0925;
- L4 confirmed at 1.0990 → stop to 1.0985.
- Exit: day 38, the close below L4 (Class 2) takes the stop at 1.0985.
Result: 1.0985 − 1.0875 = +110 pips = 3.7 times the risk (3.7R), about $913 on 0.83 lots.
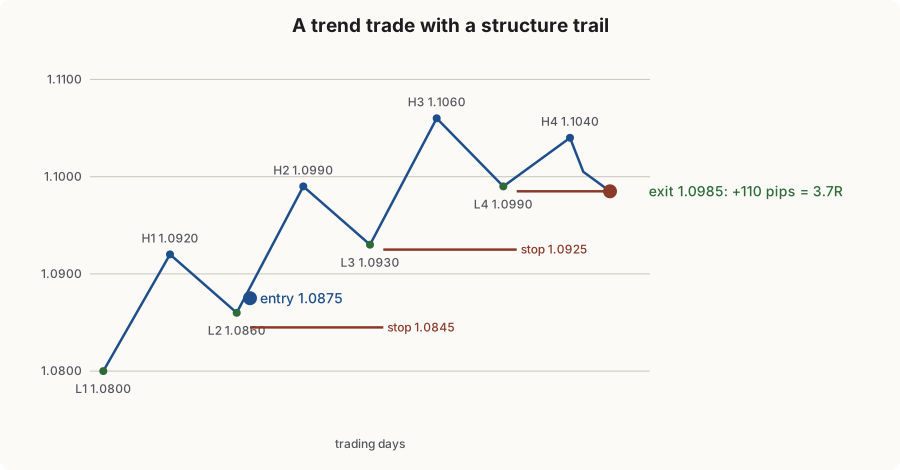
The exit came 75 pips below the top at 1.1060. That is the cost of a trend trail: you never sell the top, because the trail waits for the trend read to fail. In exchange, the trade stayed open for the whole trend.
Adding to a winner
Some trend traders add to a position as the trend proves itself (pyramiding): for example, a second position on the pullback to L3, with the stop for the whole position moved to the new higher low. Rules that keep it safe:
- Add only after the stop on the existing position has been moved so that the total risk stays within your limit.
- Add smaller amounts each time, not larger.
- Never add to a losing position. That is averaging down, the opposite of trend trading.
Why trend strategies lose more often than they win
Trend strategies take many small losses (false starts, failed breakouts, ranges) and a few large wins (the real trends). Win rates of 30% to 45% are typical, which feels bad but can be very profitable:
expectancy = win rate × average win − loss rate × average loss
40% × 3R − 60% × 1R = 1.2R − 0.6R = +0.6R per trade
Two consequences:
- Losing streaks are normal. At a 40% win rate, a run of six or more losses in a row in a hundred trades is more likely than not (see Trading Psychology). Size small enough to sit through them.
- Cutting winners short destroys the strategy. The edge is in the few large winners. A trader who takes profits at 1R “to be safe” turns a +0.6R strategy into a losing one.
Habits that keep trend trading honest
- Trade the trend you can name: direction, timeframe, strength, status (Class 1).
- Do not chase: if price is stretched far from its average (more than about 2 to 3 ATRs, Class 4), wait for a pullback.
- Stand aside in ranges: when the strength score (Class 5) says “no trend”, trend tactics lose.
- Record the trend read with every trade in your journal, and review which reads produced the results.
2 Check yourself
7 questions. Pass mark 70%. Retake as often as you like; your best score counts.