The Trend on the Outer Box Ladder
1 Read
Read the class below, including each diagram, then tick the box.
This course is free to read. Sign in to tick off each class, take the quizzes and earn the certificate.
What you will be able to do
- Read a trend as a sequence of box centers (Cs) and say whether a box is stepping up or down.
- Smooth the read with a C-average.
- Combine bias (price against C) and stepping into a direction read.
- Measure a trend’s pace by where each new C lands on the previous box’s ladder.
- Read a trend across timeframes as a chain of boxes.
- Recognize the ladder’s signs that a trend is ending.
A trend is C climbing the ladder
The Outer Box draws each completed period (a week, a month) as a box: R1 is its high, S1 its low, and C its center. Chapter 9 of the book gives the trend read in one line:
When C rises from one box to the next, the box is stepping up; when it falls, stepping down; when it barely moves, the market is consolidating.
Read this way, a trend is C climbing (or descending) the old ladder one rung at a time: the high of one box becomes the center of gravity of a later one.
A worked trend, week by week
Weekly EUR/USD, using the same swings as Classes 2 and 3:
| Week | R1 (high) | S1 (low) | C | Change in C | Read |
|---|---|---|---|---|---|
| 1 | 1.0920 | 1.0800 | 1.0860 | — | — |
| 2 | 1.0990 | 1.0860 | 1.0925 | +65 pips | Stepping up |
| 3 | 1.1060 | 1.0930 | 1.0995 | +70 pips | Stepping up |
| 4 | 1.1040 | 1.0990 | 1.1015 | +20 pips | Stepping up, much more slowly |
| 5 (live) | 1.1030 | 1.0950 | 1.0990 | −25 pips | Stepping down |
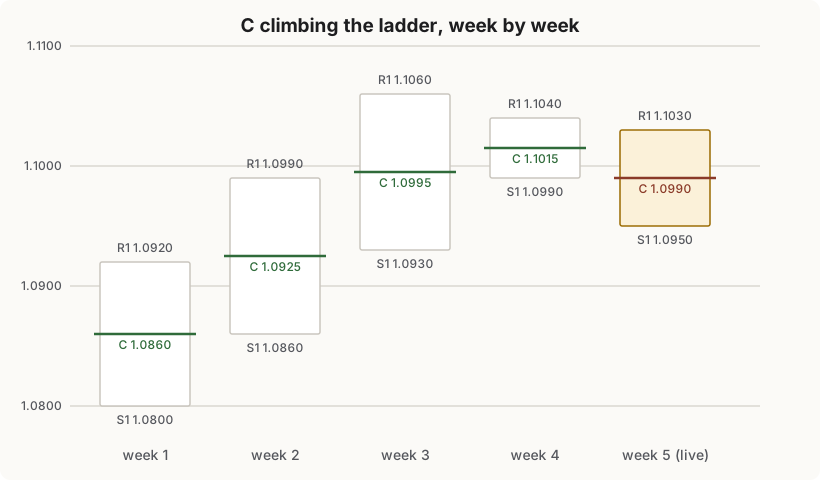
Look at where each new C lands on the previous week’s ladder:
- Week 2’s C (1.0925) is at week 1’s R1 (1.0920).
- Week 3’s C (1.0995) is at week 2’s R1 (1.0990).
- Week 4’s C (1.1015) is only 65% of the way up week 3’s box: (1.1015 − 1.0930) ÷ (1.1060 − 1.0930) = 85 ÷ 130.
That is the book’s sentence in numbers: in a healthy trend, today’s edge becomes the next box’s center. When a new C stops reaching the old edge, the trend is losing pace, the ladder’s version of a flattening trendline (Class 3). Week 5’s live box then steps down: the first time the Cs have fallen.
Stepping is read live
You do not have to wait for the week to close. The live box is the period still forming; its high and low so far give a live C. Compare it with the last C (the most recently completed box):
- Live C above last C: the box is stepping up now.
- Live C below last C: stepping down now.
In week 5, the live high is 1.1030 and the live low 1.0950: live C 1.0990, below week 4’s C of 1.1015. The week is stepping down, and it will stay that way unless price rises enough to lift the live high.
The C-average: one bad box does not end a trend
A single step down can be a pullback. The book’s C-average smooths the read: the average of the last N completed Cs, read like any moving average (Class 4), by its slope and by price’s position against it.
With N = 3 at the end of week 4: (1.0925 + 1.0995 + 1.1015) ÷ 3 = 1.0978. A week earlier it was (1.0860 + 1.0925 + 1.0995) ÷ 3 = 1.0927. The C-average is still rising, by 51 pips. One live box stepping down has not turned the smoothed read; two or three would.
Bias and stepping together: the direction
Two reads combine into the direction of a box, as the book defines it:
- Bias: which side of the box’s C price is on. Above C, bullish; below, bearish.
- Stepping: whether the live box is stepping up or down against the last one.
| Bias | Stepping | Direction read |
|---|---|---|
| Above C | Up | Uptrend, confirmed |
| Above C | Down | Uptrend, warning: the box is pulling back |
| Below C | Up | Downtrend, warning: the box is bouncing |
| Below C | Down | Downtrend, confirmed |
In week 5, price is at 1.0985: below week 4’s C (1.1015), and the week is stepping down. On the weekly box alone, that is a confirmed bearish read, the ladder’s equivalent of the break of structure in Class 2, which happened at the same price.
Breakouts: how a trend leaves its box
A trend has to leave its box, and the ladder says when that has really happened:
- R1 is the edge, not the breakout. Prices just beyond it are the breakout zone, where false breaks die (Class 8’s false breakouts).
- A close beyond 110% (or below −10%) confirms the breakout.
- R2 (150%) is the first target: where a strong breakout tends to consolidate. Once it is reached, the next box usually forms around the old R1 to R2 area, and its C sits a rung higher: the climb continues.
Each confirmed breakout, followed by a new C one rung higher, is one step of the trend on the ladder.
The chain: trends across timeframes
Class 7’s tide, waves and ripples are, on the ladder, a chain of boxes: yearly, monthly, weekly, daily.
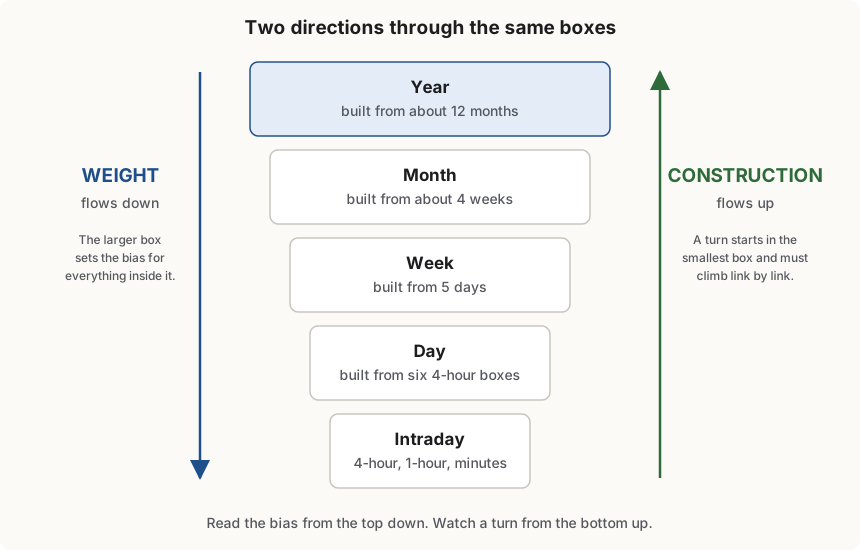
- Weight flows down. The larger box’s bias sets the base rate for every smaller box inside it (the direction timeframe in Class 7).
- Construction flows up. A monthly box is built from weeks, and weeks from days. For a monthly trend to turn, the daily boxes have to start stepping the other way first, then the weekly, then the monthly. As the book puts it, a turn climbs the chain one link at a time, and each link connects only when its box is stepping and price clears the next larger box’s levels in order.
- Intraday: when the daily boxes are stepping up and price is above the daily C, the intraday read is bullish.
So a three-timeframe trend read on the ladder is: the larger box’s bias and stepping (direction), the middle box’s stepping and position (trading), and the smaller box’s trigger (entry): the same structure as Class 7, measured with Cs instead of moving averages.
The ladder’s signs that a trend is ending
Class 8’s sequence of warning, evidence and confirmation has a ladder version:
| Class 8 | On the ladder |
|---|---|
| Warning: divergence, overshoot | Price at the edge zone (90% to R1) or beyond 110% without follow-through; new Cs land lower on the old box than before |
| Evidence: loss of pace, lower high | Steps get smaller; a live box steps down; at the top of the box, price falls back below 90% (RX), firing the bearish sentiment trigger |
| Confirmation: break of structure, regime change | Price closes below the box’s C (bias turns), completed boxes step down, and the C-average turns down |
Every method in this course, on the ladder
| Method | Its ladder counterpart |
|---|---|
| Higher highs and higher lows (Class 2) | Cs stepping up; the R1 of one box becoming the C of a later one |
| Trendline pace (Class 3) | How far each new C climbs the previous box’s ladder |
| Moving-average regime (Class 4) | Price against the C-average, and its slope |
| Strength (Class 5) | Size and consistency of the steps; where price sits in the range |
| Momentum (Class 6) | Steps getting smaller while price still makes new highs |
| Timeframes (Class 7) | The chain: yearly, monthly, weekly, daily boxes |
| Start and end (Class 8) | Breakouts confirmed at 110% and carried to R2; RX triggers and closes below C |
The ladder does not replace the other methods. It gives each one a fixed set of levels, the same for everyone who draws the box, so a trend read can be written as prices rather than impressions.
The one-sentence trend read, Outer Box style
Monthly: bullish, price at 64% of the range, stepping up. Weekly: Cs stepping up for three weeks but by less each week; the live week is stepping down below the last C. Daily: below C and stepping down. Reading: monthly uptrend intact; weekly pullback under way; no long until a daily bullish sentiment trigger at a weekly or monthly level.
The Target Grader on the site turns the larger boxes’ bias and stepping into a vote count for each target, which is the same read in numbers.
2 Check yourself
8 questions. Pass mark 70%. Retake as often as you like; your best score counts.