Indicators Through the Outer Box
Many Indicators Are Boxes Already
1 Read
Read the class below, including each diagram, then tick the box.
This course is free to read. Sign in to tick off each class, take the quizzes and earn the certificate.
Two kinds of box
The Outer Box uses a locked box: the high and low of the last completed period, such as last month. Its levels do not move until the next month closes (Chapter 8 of the book).
Many indicators use a rolling box: the high and low of the last N bars, recalculated on every new bar. Its edges move as old bars drop off the back and new ones arrive.
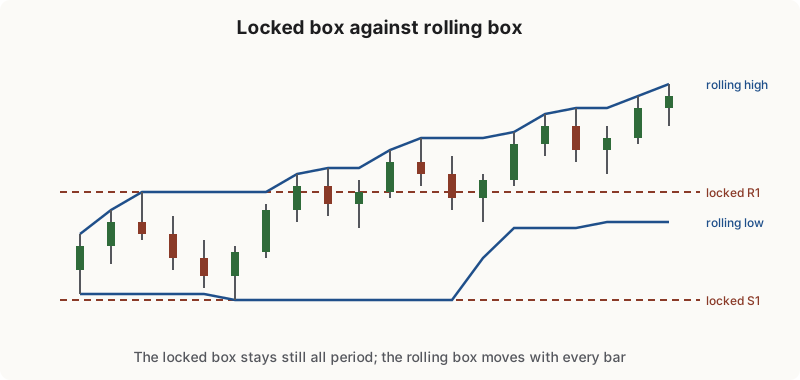
Both are boxes, with an R1, an S1 and a C. The difference is whether the reference stays still. A locked box is a fixed ruler you can measure against for a whole period; a rolling box follows price and reacts faster, but never stands still long enough to show a confirmed break of its own edge.
The Donchian channel: a rolling R1 and S1
The Donchian channel draws the highest high and the lowest low of the last N bars, often 20. Its upper line is a rolling R1, its lower line a rolling S1, and many versions draw the middle line too: a rolling C.
The classic Donchian breakout buys when price makes a new 20-bar high. In Outer Box terms, that is buying the break of R1. Chapter 12 explains why the book waits for 110% instead: the zone just past the edge is where false breaks happen.
The stochastic and Williams %R: position in the box
The stochastic oscillator (%K) asks one question: where is the close inside the box?
%K = (close − lowest low) ÷ (highest high − lowest low) × 100
That is the Outer Box’s percent of range, measured on a rolling box, usually 14 bars. 0 is S1, 50 is C, 100 is R1.
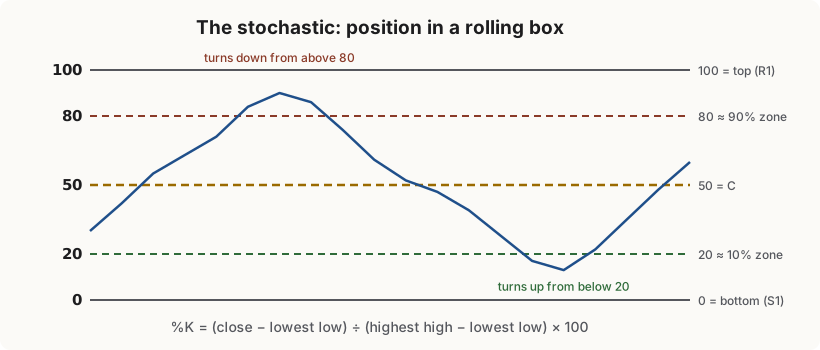
- The stochastic’s usual 80 and 20 lines are its edge zones, close to the ladder’s 90% and 10%.
- A stochastic turning down from above 80 is a rolling-box version of the bearish sentiment trigger (Chapter 10): a test of the top of the box, then a retreat inside it.
Williams %R is the same measurement upside down: 0 at the top of the box and −100 at the bottom.
Ichimoku: three rolling Cs
The Ichimoku cloud looks complicated, but three of its lines are simply box centers:
| Line | How it is calculated | In box terms |
|---|---|---|
| Tenkan-sen | (9-bar high + 9-bar low) ÷ 2 | C of a rolling 9-bar box |
| Kijun-sen | (26-bar high + 26-bar low) ÷ 2 | C of a rolling 26-bar box |
| Senkou Span B | (52-bar high + 52-bar low) ÷ 2, drawn 26 bars ahead | C of a rolling 52-bar box |
Price above the Kijun-sen is Ichimoku’s version of the book’s bias rule (Chapter 9): above C, bullish; below C, bearish, on a rolling box instead of a locked one.
Why this matters
If two indicators measure the same thing, adding the second tells you nothing new. A chart with the ladder, a stochastic and a Donchian channel shows the same box three times. Knowing what each indicator is made of lets you choose one tool for each job instead of stacking copies.
2 Check yourself
6 questions. Pass mark 70%. Retake as often as you like; your best score counts.