Indicators Through the Outer Box
Momentum for Timing: MACD, RSI and the TDI
1 Read
Read the class below, including each diagram, then tick the box.
This course is free to read. Sign in to tick off each class, take the quizzes and earn the certificate.
Direction and timing are different questions
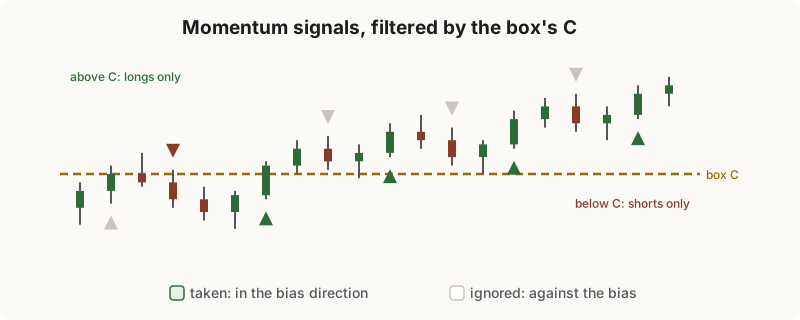
The Outer Box answers direction: price above the box’s C favours the long side, below C the short side (Chapter 9, the bias rule). It does not say exactly when to act.
Momentum indicators answer a timing question: is the push in one direction speeding up or slowing down right now? Used on their own, they give signals in both directions all the time. Used inside the box’s bias, you keep the signals that agree with the bigger picture and ignore the rest.
MACD
The MACD (moving average convergence divergence) measures the gap between a fast and a slow average of price:
- MACD line = 12-bar EMA − 26-bar EMA (an EMA is an exponential moving average, which weights recent bars more).
- Signal line = 9-bar EMA of the MACD line.
- Histogram = MACD line − signal line.
The most common signal is the MACD line crossing its signal line: up for a buy, down for a sell. A cross above or below zero is a slower version of the same idea.
MACD is built from averages, so it lags: on short intraday charts, its crosses often come after much of a move has happened.
RSI
The Relative Strength Index, developed by J. Welles Wilder, compares the size of recent up-closes with recent down-closes, on a scale of 0 to 100. The usual setting is 14 bars, with 70 and 30 marked as overbought and oversold.
RSI reacts faster than MACD, and its 0 to 100 scale reads like the ladder: 50 in the middle, edge zones at the top and bottom. But it measures the speed of closes, not price’s position in a box, so a market can trend for a long time with RSI above 50, and RSI can sit above 70 while price keeps rising.
The Traders Dynamic Index (TDI)
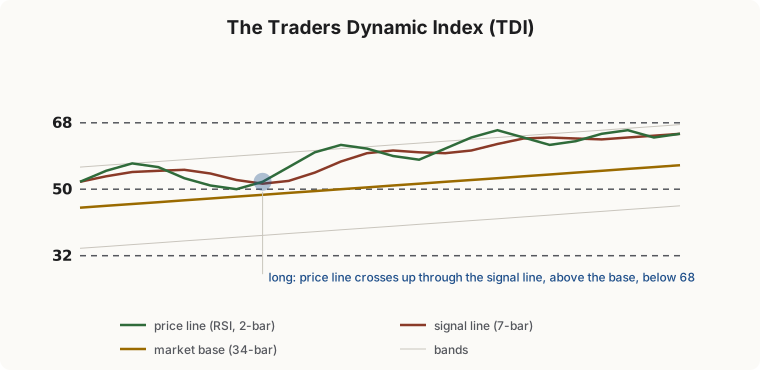
The TDI builds a whole ladder out of RSI:
- an RSI (often 13 bars), smoothed into a fast price line (2-bar average) and a slower signal line (7-bar average);
- a market base line: a 34-bar average of the RSI, the TDI’s own C;
- volatility bands around the base line, at about 1.6 standard deviations: the TDI’s own R1 and S1;
- the 32, 50 and 68 levels: its extremes and midline.
A common TDI entry is the price line crossing the signal line, on the right side of the market base, and not already beyond the 68 or 32 extremes.
Using momentum inside the box
Whichever indicator you use, the same three rules keep it in its place:
- The box decides the side. Price above the outer box’s C: only long signals count. Below C: only short signals.
- The indicator decides the moment. A momentum signal in the allowed direction, ideally near a ladder level (C, the edge zone, or a sentiment trigger), is the entry.
- The ladder decides the exits. The stop goes beyond the threshold that proves the reading wrong, and the target at the next level, as in Chapter 21, not where the indicator turns back.
A signal against the bias is not a reason to reverse. At most, it is a reason to tighten the stop on the trade you have.
Which one for intraday?
There is no single answer, but a reasonable starting point is: faster indicators (RSI, TDI) for short charts, slower ones (MACD) for longer ones, each filtered by the box’s bias. Class 4 shows how to compare them on your own charts rather than taking anyone’s word for it.
2 Check yourself
6 questions. Pass mark 70%. Retake as often as you like; your best score counts.