Indicators Through the Outer Box
Moving Averages, Bollinger Bands and the C-Average
1 Read
Read the class below, including each diagram, then tick the box.
This course is free to read. Sign in to tick off each class, take the quizzes and earn the certificate.
Moving averages
A moving average is the average closing price of the last N bars, recalculated each bar.
- A simple moving average (SMA) weights every bar equally.
- An exponential moving average (EMA) gives recent bars more weight, so it turns sooner.
Common lengths are 20 (short-term), 50 (medium) and 200 (long-term). A rising average with price above it describes an uptrend; a falling one with price below it, a downtrend. Two averages crossing, a short one above a long one, is the well-known golden cross; below, the death cross.
The C-average: averaging box centers
Chapter 9 of the book builds the same tool from a different ingredient. Instead of averaging closes, the C-average averages the last few boxes’ centers:
C-average = the average of the last N boxes’ C values
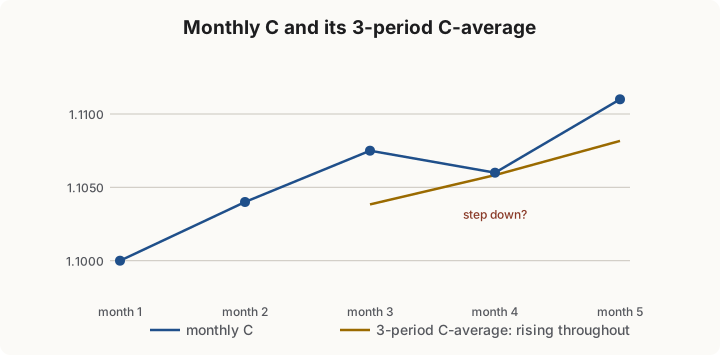
The step-by-step read says the fourth month stepped down. The 3-period C-average rises every time, because one dipping month is outweighed by the two around it. Read it exactly like a moving average: rising means the outer trend is confirmed by more than one box at once.
Why use centers instead of closes? A close is one moment at the end of the period, and it can be pushed around in the last hour. A box’s center reflects the whole period’s range, high and low. Two C-averages, a short and a long one, give the box model’s version of the golden and death crosses, built from where each period actually traded.
Bollinger Bands: a box that breathes
Bollinger Bands draw a 20-bar moving average with a band 2 standard deviations above and below it. When prices swing widely, the bands spread apart; when the market is quiet, they squeeze together.
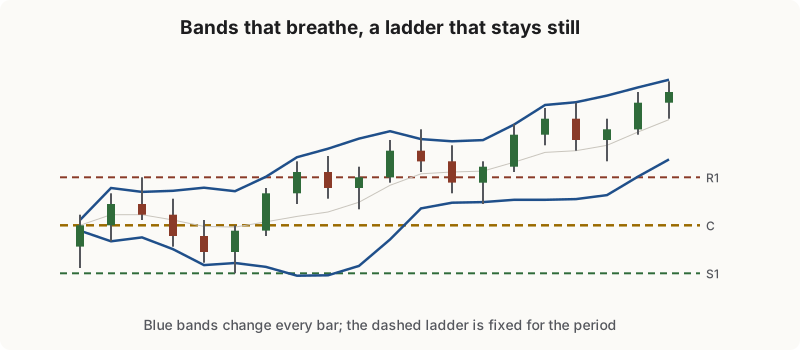
The bands and the ladder look alike, an upper edge, a lower edge and a middle, but they answer different questions:
| Bollinger Bands | Outer Box ladder | |
|---|---|---|
| Built from | Average and spread of recent closes | High and low of a completed period |
| Changes | Every bar | Once per period |
| Answers | Is price unusually far from its recent average? | Where is price inside the range the market has already set? |
A squeeze, bands at their narrowest in months, often comes before a large move but does not say which way. The box’s bias, above or below C, is one way to lean before the move starts. The confirmation, as always, is the 110% or −10% level, not the first poke through a band.
Using averages with the ladder
- Use one average for trend, not five. If you use the book’s method, the C-average already does this job.
- Treat an average near a ladder level as a coincidence worth noting (Chapter 19): two different tools pointing at the same price.
- Do not let an average override the ladder. A price below the 50-bar average but above the monthly C is still above C; the bias rule comes from the box.
2 Check yourself
6 questions. Pass mark 70%. Retake as often as you like; your best score counts.