Indicators Through the Outer Box
Combining Indicators and Testing Them Honestly
1 Read
Read the class below, including each diagram, then tick the box.
This course is free to read. Sign in to tick off each class, take the quizzes and earn the certificate.
One tool per job
A trade needs answers to a few separate questions. Pick one tool for each:
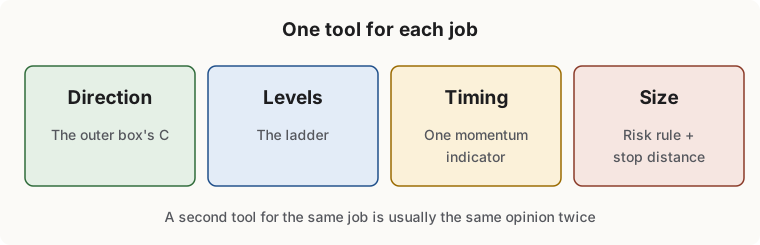
| Job | Question | One tool |
|---|---|---|
| Direction | Which side do the odds favour? | The outer box’s C (bias rule) |
| Levels | Where are entry, stop and target? | The ladder |
| Timing | Is now the moment? | One momentum indicator |
| Size | How much? | Your risk rule and the stop distance |
Adding a second tool for the same job feels like more confirmation, but if both tools are made from the same ingredients, it is the same opinion twice.
The redundancy trap
These groups mostly measure the same thing:
- Position in a recent range: stochastic, Williams %R, Donchian channel, the TDI’s bands.
- Speed of recent closes: RSI, momentum, rate of change, the TDI’s price line.
- Trend from averages: moving averages, MACD, the C-average.
Three indicators from one group agreeing is not three confirmations. One from the range group and one from the speed group, filtered by the box, is a more honest pair.
Testing whether something helps
Before you trust an indicator, a setting or a filter, compare it against not using it. Chapter 22 of the book applies this to the Outer Box itself: state the rule, pick a baseline, and count.
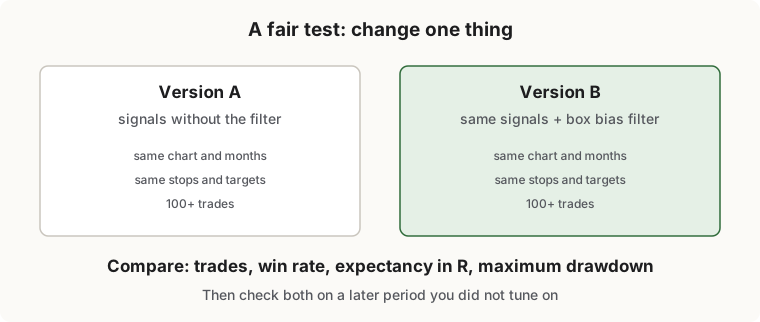
A simple, fair test:
- Write the rule exactly. For example: “On a 15-minute EUR/USD chart, buy when the TDI price line crosses up through its signal line above the market base, only while price is above the daily box’s C. Stop beyond the trading box’s −10%. Target the daily C or the next level.”
- Choose the baseline. The same rule without the C filter.
- Use enough trades. Ten trades tell you almost nothing; aim for at least 100 of each version, across different months.
- Compare the right numbers: expectancy in R, maximum drawdown and the longest losing streak, not just the win rate (Risk and Money Management, class 3).
- Check it on data you did not tune it on. Choose your settings on one period, then see whether they still work on a different period. Settings that only work on the data they were fitted to usually stop working.
Many platforms can count for you
Most charting platforms let a study or strategy keep its own record of trades on past bars, with the win rate, profit factor and drawdown. Run version A and version B on the same chart and the same dates, and write both results down. Treat the numbers as a test of rules on the past, not a promise about the future.
When the test says no
If the filter does not help, or helps on one pair and hurts on another, believe the test. The point of testing is to find out, not to confirm what you hoped. A smaller set of rules that you have checked is worth more than a larger set that you have not.
2 Check yourself
6 questions. Pass mark 70%. Retake as often as you like; your best score counts.