Which Floors and Ceilings Matter Most
1 Read
Read the class below, including each diagram, then tick the box.
This course is free to read. Sign in to tick off each class, take the quizzes and earn the certificate.
In First Steps you found floors and ceilings on a chart. Here’s the catch: every chart has dozens of them. This class is about picking the few that really matter, and it leads straight into the idea at the heart of the Outer Box.
New words in this class: swing high, swing low and zone.
Finding levels: peaks and dips
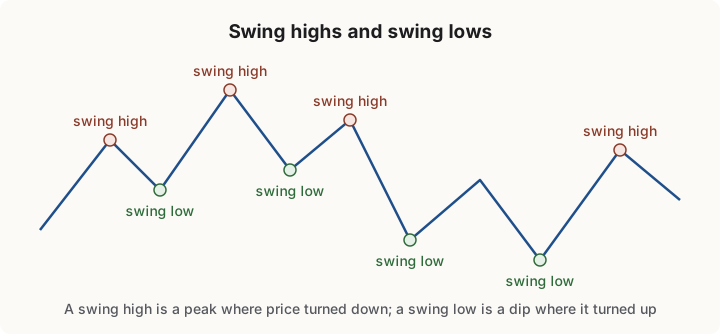
- A swing high is a peak: price rose, stopped and turned down. It marks a possible ceiling (resistance).
- A swing low is a dip: price fell, stopped and turned up. It marks a possible floor (support).
Think of a level as a zone, a narrow band rather than a razor-thin line. Price often turns a little before or after it.
Why levels work
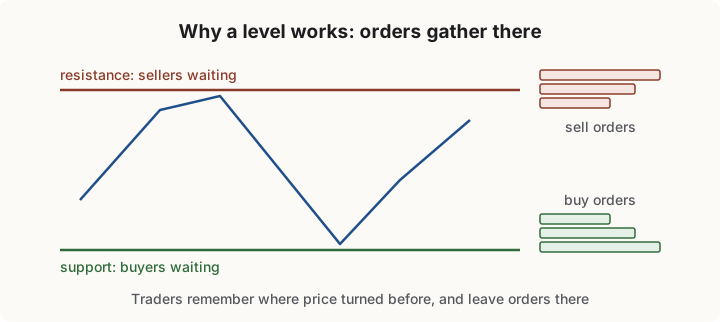
As you saw in First Steps: people remember where price turned, and they leave orders there. Sellers wait at the ceiling, buyers wait at the floor. A level on a chart is really a map of where orders are waiting.
Not all levels are equal
Here’s the problem. A five-minute chart has dozens of swings a day; draw them all and your chart turns into spaghetti. So which ones count?
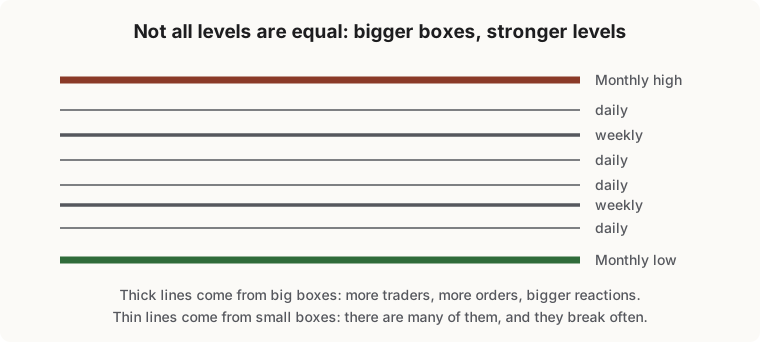
The bigger the period a level comes from, the stronger it is.
- A monthly high is where a whole month of buyers was turned back. Lots of traders saw it; lots of orders sit there.
- A daily high is the same thing for one day: fewer people, fewer orders, a smaller reaction.
So a daily level breaking is routine; a monthly level breaking is news. And when a small level lines up with a big one, it carries the weight of both.
Broken levels change sides
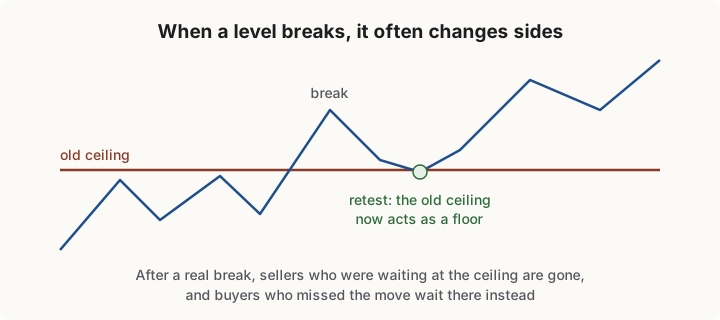
You saw this in First Steps too: when a ceiling breaks, it often becomes a floor on the way back down, and a broken floor often becomes a ceiling. One caution: price often pokes just past a level and falls straight back. Not every poke is a real break; Foundations teaches a measured way to tell them apart.
The two strongest prices of all
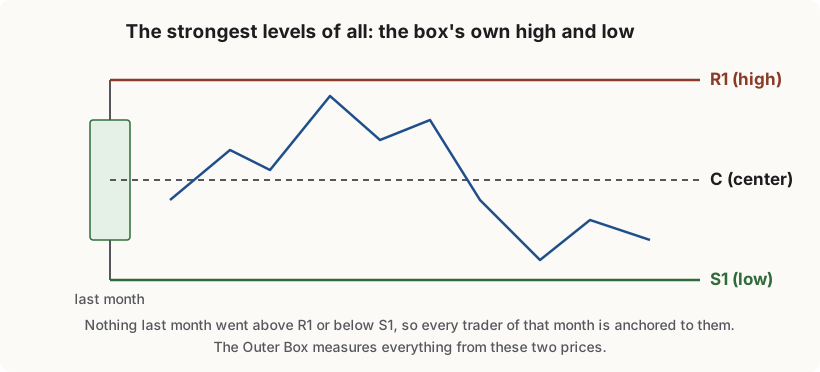
Take last month’s candle. Its high is the one price nothing last month got above. Its low is the one price nothing got below. Every trader of that month is anchored to those two prices, so they are the strongest ceiling and floor that month produced.
The Outer Box calls them R1 (the high) and S1 (the low), draws them as a box, and measures everything from them. The first thing it measures is C, the centre, exactly halfway between: above C, buyers have the upper hand; below C, sellers do.
That’s the whole method in one sentence: find the strongest floor and ceiling, the high and low of a completed period, and measure everything from them.
Remember
- Swing highs and swing lows mark possible ceilings and floors; treat each as a zone.
- The bigger the period, the stronger the level.
- Last period’s high and low (R1 and S1) are the strongest of all; C is halfway between.
Where next
The book covers this in Chapter 7 and Chapter 8. This is the last Market Basics class: next on your path is Forex Essentials.
2 Check yourself
5 questions. Pass mark 70%. Retake as often as you like; your best score counts.