Volatility
1 Read
Read the class below, including each diagram, then tick the box.
This course is free to read. Sign in to tick off each class, take the quizzes and earn the certificate.
What you will be able to do
- Tell historical volatility from implied volatility, and say which one option prices use.
- Turn an implied volatility into an expected move in dollars, for any number of days.
- Judge whether options are cheap or expensive for that stock with IV rank.
- Explain the volatility crush after earnings, and avoid paying for it.
- Read the volatility skew and the VIX.
Two kinds of volatility
Volatility is a measure of how much a price tends to move, stated as an annual percentage (one standard deviation of returns over a year).
- Historical volatility (also realized or statistical volatility) is measured from past prices. If XYZ’s daily moves over the last 30 days annualize to 25%, its 30-day historical volatility is 25%.
- Implied volatility (IV) is worked backward from option prices: the volatility that, put into a pricing model with the other known inputs, gives the option’s market price. It is the market’s forecast of volatility until expiration, and it is what you pay for when you buy an option.
When implied volatility is well above recent historical volatility, options are pricing in movement that has not been happening. When it is below, options are pricing in calm. Neither is “wrong”; the market often expects an event (earnings, a central-bank decision) that the past does not contain.
From implied volatility to an expected move
Implied volatility is annual. To scale it to any number of days, multiply by the square root of the fraction of a year:
expected move ≈ stock price × IV × √(days ÷ 365)
For XYZ at $100, IV 30%, 30 days:
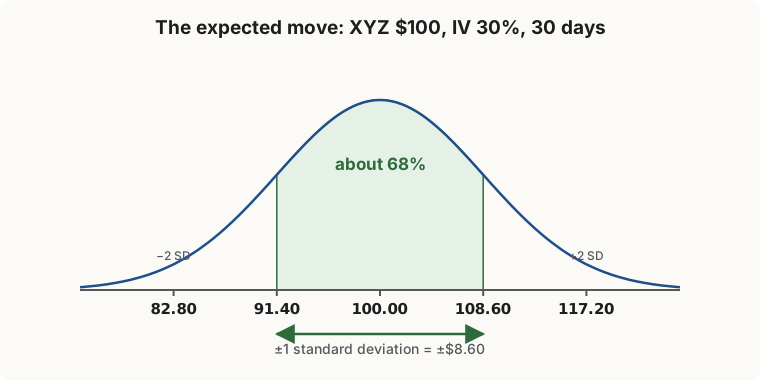
100 × 0.30 × √(30 ÷ 365) = 100 × 0.30 × 0.287 = $8.60
That is one standard deviation. If returns behaved like the bell curve the model assumes, XYZ would finish between $91.40 and $108.60 about 68% of the time, and between $82.80 and $117.20 (two standard deviations) about 95% of the time. Real markets have fatter tails than the bell curve: big moves happen more often than it predicts, so treat these as estimates, not guarantees.
Two quick versions traders use:
- One day: IV ÷ 16 is about the expected daily move in percent (because √256 = 16, close to the number of trading days in a year). At IV 32%, the market expects about 2% a day.
- From the straddle: the price of the at-the-money call plus the at-the-money put is about 0.8 × the expected move. XYZ’s 100 call and put cost 3.59 + 3.26 = 6.85; 0.8 × 8.60 = 6.88. Many traders simply quote the straddle price as “the move the market is pricing”.
Is volatility high or low? IV rank and IV percentile
30% implied volatility is high for a utility stock and low for a young biotech. To judge a stock’s IV against its own history, platforms show:
IV rank = (current IV − 52-week low IV) ÷ (52-week high IV − 52-week low IV) × 100
If XYZ’s IV has ranged from 18% to 50% over the past year and is now 30%:
(30 − 18) ÷ (50 − 18) × 100 = 12 ÷ 32 × 100 = 37.5
IV percentile answers a slightly different question: on what share of days in the past year was IV lower than today? Both run from 0 to 100. A common rule of thumb:
- High IV rank (say above 50): options are expensive for this stock, which favors selling premium (Class 7) or buying spreads rather than single options.
- Low IV rank (say below 25): options are cheap for this stock, which favors buying options or debit spreads (Class 6).
This is a tendency, not a law. Volatility can stay high for a long time, and it is high for a reason.
The volatility crush
Implied volatility rises before known events (earnings, product launches, court rulings, economic releases) because the market expects a jump. Once the news is out, the uncertainty is gone and IV falls, often by half overnight. That fall is called the volatility crush.
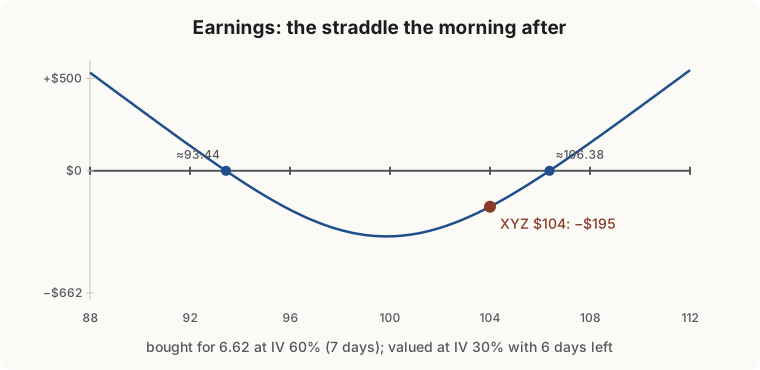
Example. XYZ reports earnings tonight. The weekly 100 call (7 days left) is priced at an IV of 60%, so it costs 3.35; the 100 put costs 3.27; the straddle costs 6.62, pricing a move of about $8.30.
The next morning XYZ is up 4%, at $104. Your direction was right. But IV has fallen to 30%, and a day has passed:
| Before (IV 60%, 7 days) | After (XYZ $104, IV 30%, 6 days) | Profit or loss | |
|---|---|---|---|
| 100 call | 3.35 | 4.37 | +$102 |
| 100 put | 3.27 | 0.30 | −$297 |
| Straddle (call + put) | 6.62 | 4.67 | −$195 |
- The call made money, but only $102 on a 4% move, because the crush took most of the gain.
- The straddle, a bet on “a big move either way”, lost $195 on a 4% move, because the market had priced in more than 4%.
The lesson: buying options into a known event is a bet that the move will be bigger than the market already expects. If you think the move will be normal, the crush works against you. Many traders either avoid holding long options through earnings or use spreads (Class 6), where the crush on the sold leg offsets the crush on the bought leg.
Skew: not every strike has the same IV
If you look at implied volatility strike by strike, it is rarely flat.
- On stock indexes (SPX, SPY, QQQ), out-of-the-money puts carry higher IV than out-of-the-money calls. Crashes are fast and rallies are slow, and investors pay up for protection. This downward tilt is called the skew (or smirk).
- On some commodities, the tilt can go the other way, because supply shocks spike prices up.
- On stocks with a pending takeover or binary event, the curve can take odd shapes.
Skew is why an index put 5% below the market usually costs more than a call 5% above it, and why selling those puts pays more than the bell curve suggests (it also carries the crash risk that justifies the price).
The VIX
The Cboe Volatility Index (VIX) is the 30-day implied volatility of the S&P 500, calculated from a wide range of SPX option prices. When people say “the VIX is at 20”, they mean the options market expects the S&P 500 to move about 20% a year, or about 20 ÷ 16 = 1.25% a day.
- The VIX usually rises when stocks fall quickly, and drifts lower in steady rallies.
- It is a gauge of the price of index options, not a forecast of direction.
- You cannot buy the VIX itself. VIX futures, options and the exchange-traded products built on them behave very differently from the index and can lose value steadily; they are beyond this course.
For an individual stock, the equivalent is that stock’s own implied volatility and IV rank on your platform.
2 Check yourself
7 questions. Pass mark 70%. Retake as often as you like; your best score counts.